Iraq Roadmap to Victory: July Update
This is the second installment of my series where I have created some tracking tools to measure our progress in Iraq. The first post was just a draft where all the metrics were parked in neutral. Now, I've done some analysis and evaluation. I'm not going to link every source that I've used. I read far too much to keep track of it all.
I believe that this evaluation will meet with some controversy. My liberal readers will probably surmise that I'm giving an impression of too much progress. Conservatives might think that I haven't been generous enough. I think my evaluation is fair.
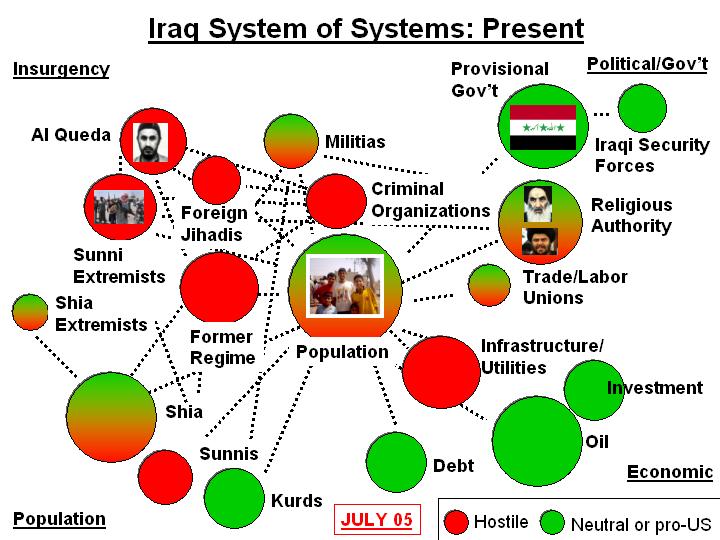
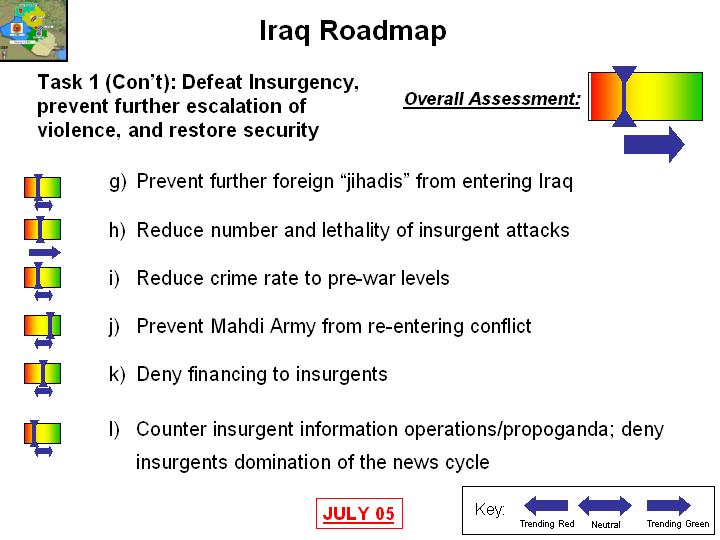
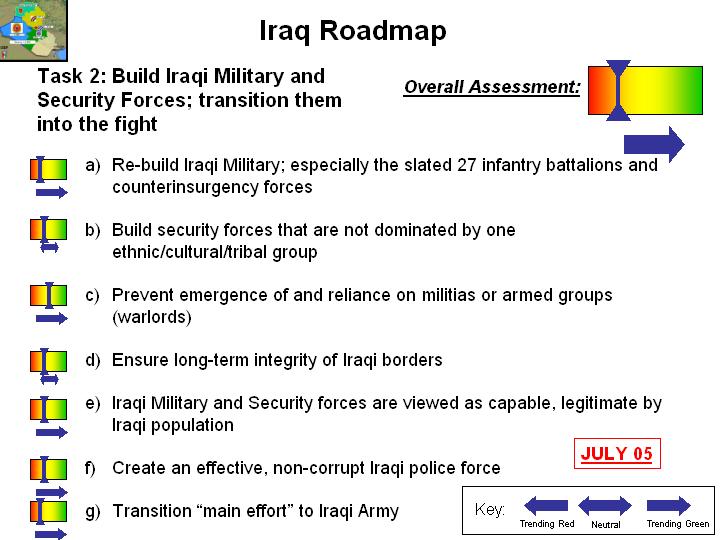
These charts illustrate some progress. Many of my metrics are trending towards the green. But, you should not that most of them are still evaluated as red or yellow. This means that we have a long way to go. Progress is incremental in some areas, glacial in others. It may take years of positive trending to fix some areas like infrastructure.
I will update these slides every month or two. If you don't agree with my assessments, by all means post your comments and your own evaluations. But, be prepared to back it up. If you want to rant, take it somewhere else. I value ideas over ideology.
One note on my analysis: These charts are the product of my own work from available open-source information and the occasional email from friends in Iraq. By no means do they reflect some official product that I've migrated into the blogosphere. Enjoy.


posted by Kris Alexander @ Thursday, July 21, 2005
10 comments
![]()


10 Comments:
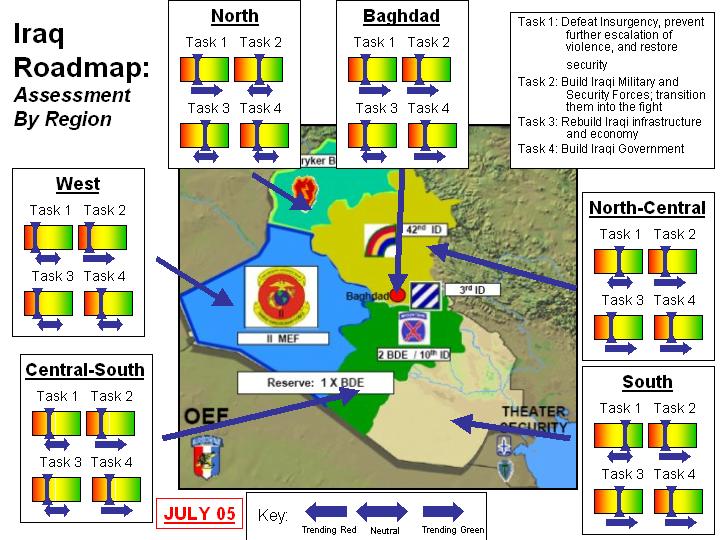
I think Mosul should be "trending to red". We're losing Mosul,at least for now.
Doesn't the color green here really represent Iran?
I would take into account this map.
DOD reports 60 attacks on average per day. Another thing to consider is population numbers. I.E. Baghdad has 6-77 million people, and represents 35% of the attacks, or basically 5% per million/ 3 attacks per million population/day.
While AlAnbar has 12 attacks/million population/day. Ninewa averages 10 attacks/day or 4 attacks per million population. Saladin averages 8 attacks/day or 8 attacks per million. Diyala and Tamin are both at 3 attacks/day.
Babil province is at something line 2 attacks per day.
Everywhere else is at normal crime rate excepting the occasional "Big Event", which can't really be quantified as a provincial trend.
As far as "losing nineva" province comment. A significant number of troops have been added in the last 2 months. Losing is the wrong term...as many cities and villages that had been left to fester for the last 6 months are being cleaned out.
http://www.globalsecurity.org/military/ops/images/oif-map-050700.gif
I don't understand how you can believe that infrastructure is trending positive while security is still so terrible. From all reports, it seems that effective work on infrastructure has been almost impossible due to poor security, and indeed many foreign contractors have given up and gone home. Of the funds appropriated for reconstruction, only a small portion has been spent, and much of that had to be diverted to security. Not to mention the $9B which is unaccounted for. With the insurgents still mounting effective attacks on oil and electricity infrastructure, it seems that both oil and electricity production are stagnant at below pre-war levels, and not in fact rising at all. Or do you have data to
suggest otherwise ?
So in a way I believe your roadmap would be improved by presenting it as a project plan with dependencies between the items.
But there may be circular dependencies ...
Richard,
Part of the problem with the project is that this is the first post. Yes, the infrastructure is trending towards the green but at a very slow speed. Too slow if you ask me. So at this rate, it might take a year to get it firmly into the yellow. Its still a positive trend, but may reflect other problems. As I do this more, it will be easier to evaluate.
You're right that there are circular dependencies. Security runs through all this as a circular dependency or at least a linked one. And some are not as heavily linked. For instance, the Iraqis could draft a perfect constitution, and it still doesn't do a damn thing to keep the lights on so it's useless.
The next time I do this, I'm going to expand a couple of the tasks to illustrate their interdependence and the associated assessments and information that goes along with it. These "drill down" slides will help explain my thinking more. However, I'm not sure that I want to do it for every task. Nobody would read a post with 100 slides. Death by Powerpoint.
Thanks for your reply. I remain skeptical especially about oil and electricity infrastructure, but also clean water and
sewage. These are all systeems which require considerable maintenance just to keep functioning. With poor security inhibiting maintenance, and sabotage also causing degradation, what makes you think the trend is positive.
A few months back I saw an analysis of eleectricity production based on official figures. There had been a string of positive articles about improvements, but
actual generation only briefly reached the pre-war level, then dropped far down.
So there has been a lot of misinformation, some of it probably from official sources, suggesting positive trends which never materialize in the hard statistics. Hence my skepticism.
RE: Infrastructure
Infrastructure means more than public utilities. Roads, ports, bridges, hospitals, transportation, schools can all be considered part of infrastructure. Of course, this leads to a problem with my slides. I use the word "utilities" which is too narrow so I'll need to fix the verbage.
But, there have been incremental improvements in these areas, especially in the ports. There has also been improvement in transportation. Iraq airlines is up and running. There are now shuttle flights between Baghdad and Basra. Sure these are small steps, but they have a cumulative effect.
So I'll have a utilities task and an economic infrastructure task. Fair enough?
I think you've done a great job. This is something we should be getting from our government.
I do have some quibbles as to how some of the items can be measured objectively, but, by and large, you can feel quite proud of your efforts.
In future slides, could you use colors more different than green and red? I have bad color vision and I really can't tell which is which.
Otherwise, this is really well done.
Post a Comment
<< Home